This article is for educational purposes only. Always consult with a qualified audiologist for personalised advice. Individual results may vary.
You’ve had your hearing test, and now you’re looking at a chart with lines and symbols. What does it all mean? Understanding your results helps you make informed decisions about your hearing health.
What Is an Audiogram?
An audiogram is simply a graph that shows your hearing ability at different pitches (frequencies) and volumes (decibels). It’s like a map of your hearing.
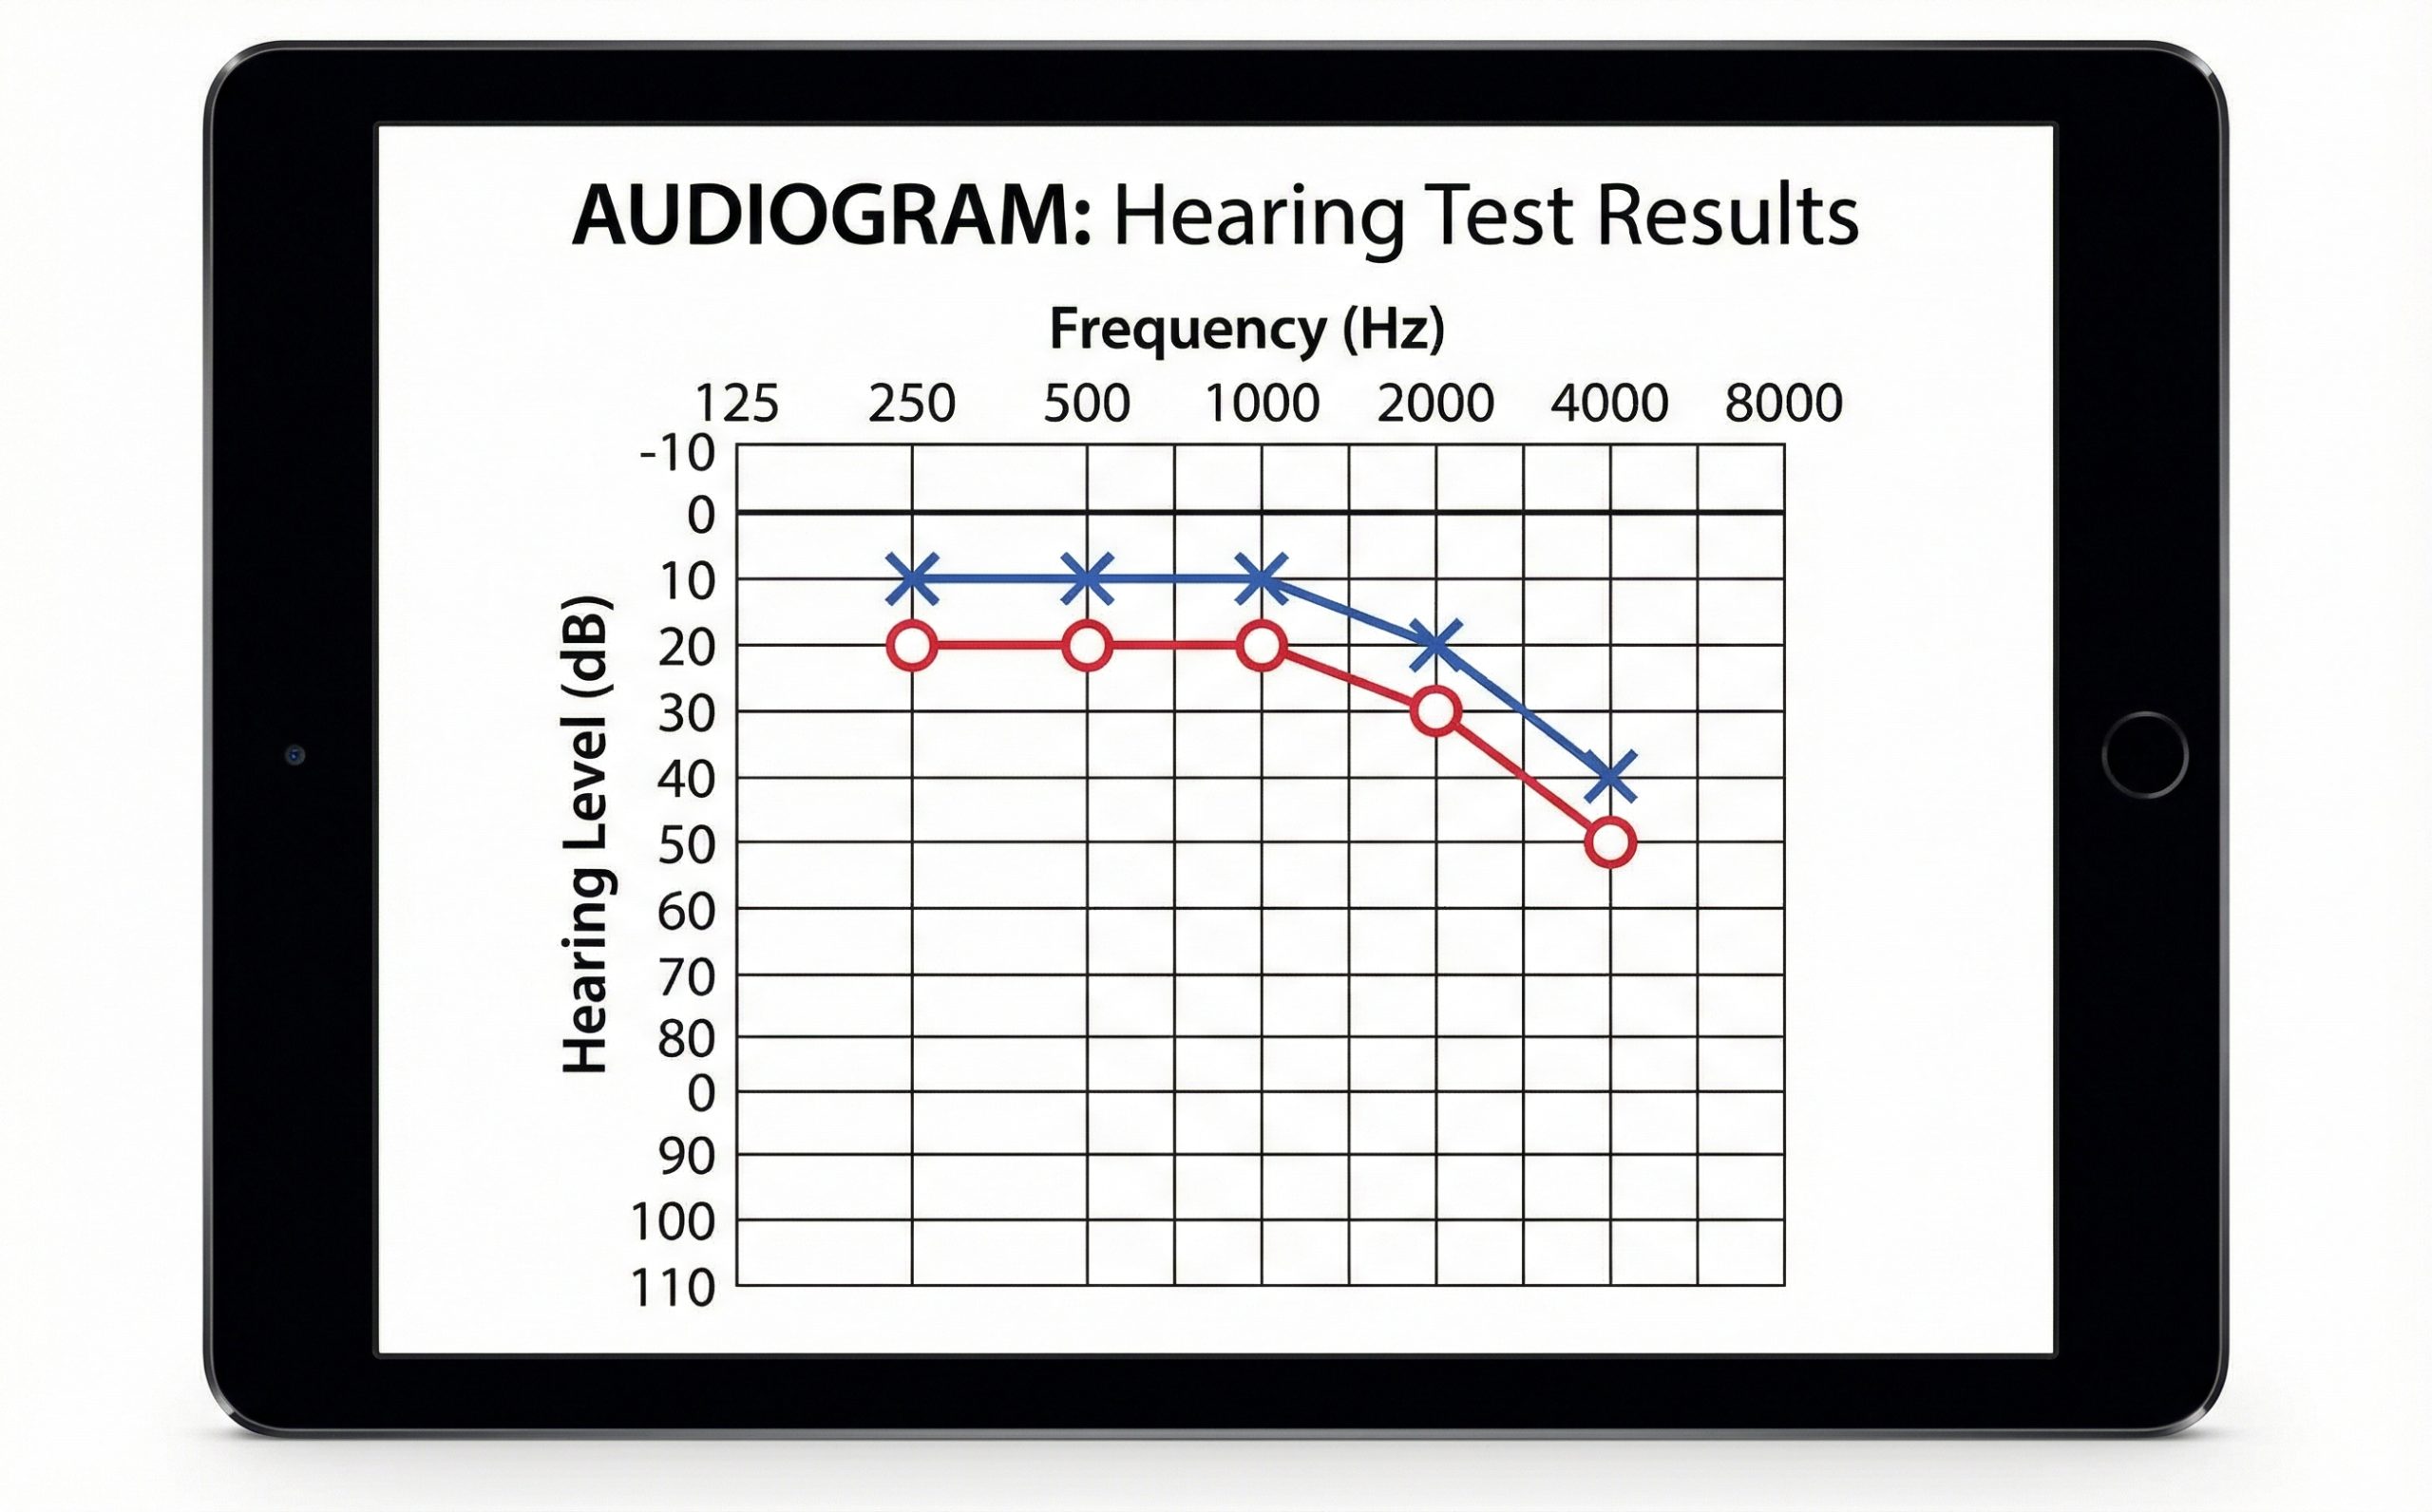
The horizontal axis shows frequencies from low (like a bass drum) on the left to high (like a bird chirping) on the right. The vertical axis shows volume – with very soft sounds at the top and louder sounds at the bottom.
Your results are plotted as points on this graph, showing the softest sounds you can hear at each frequency. Lines connect the points to create a picture of your overall hearing.
Reading the Numbers
Hearing is measured in decibels (dB). Normal hearing is typically between 0-25 dB across all frequencies. This means you can hear very soft sounds without difficulty.
If your results show hearing in the 26-40 dB range, this is considered mild – you might miss soft speech or have trouble in noisy environments. The 41-55 dB range is moderate, where normal conversation becomes more challenging.
Beyond that, there’s moderately severe (56-70 dB), severe (71-90 dB), and profound (90+ dB). Each level indicates how much sound information you might be missing.
The Pattern Matters Too
It’s not just about the numbers – the shape of your audiogram tells a story. Many people have what’s called a ‘sloping’ pattern, where low frequencies are near-normal but high frequencies show more change.
This is common with age-related hearing changes and noise exposure. It explains why you might hear that someone is talking, but struggle to understand the words clearly – especially consonant sounds like ‘s’, ‘f’, and ‘th’.
Other patterns include flat losses (similar across all frequencies) or notched patterns (a dip at specific frequencies, often from noise damage).
What About Speech Testing?
Your audiologist likely also tested your speech recognition – how well you understand words when they’re loud enough to hear. This is important because hearing and understanding are different skills.
Good speech scores suggest that with the right amplification, you’re likely to understand speech well. Lower scores might indicate that additional strategies beyond amplification could be helpful.
What the Results Mean for You
Your audiogram is personal to you. Two people with similar patterns might experience hearing very differently depending on their lifestyle, communication needs, and listening environments.
That’s why the conversation with your audiologist matters as much as the numbers. They’ll help you understand how your results relate to the situations where you’re finding things challenging.
Don’t hesitate to ask questions. Your audiologist is there to help you understand your hearing and explore options that might help.
Key Takeaways
- An audiogram maps your hearing across different pitches and volumes
- Normal hearing is typically 0-25 dB across all frequencies
- The pattern of your results tells an important story
- Speech understanding is tested separately from pure-tone hearing
- Your audiologist will help you understand what results mean for you
Have questions about your hearing test results? Our team is here to explain things clearly and help you understand your options.